
Safety hysteresis in traffic flow: Evidence from vehicle trajectory data
Published in Transportation Research Part C: Emerging Technologies, 2026
Abstract
Highlights
Reveals the hysteresis phenomenon in traffic safety using real-world trajectory data.
Identifies pair-level and platoon-level hysteresis loops in traffic safety.
Proposes Safety Hysteresis Intensity (HI) as the quantification metric.
Empirical results show clear differences between naturalistic and controlled environments.
Finds speed differences, harsh braking, and flow fluctuations amplify safety HI.
Existence of Safety Hysteresis
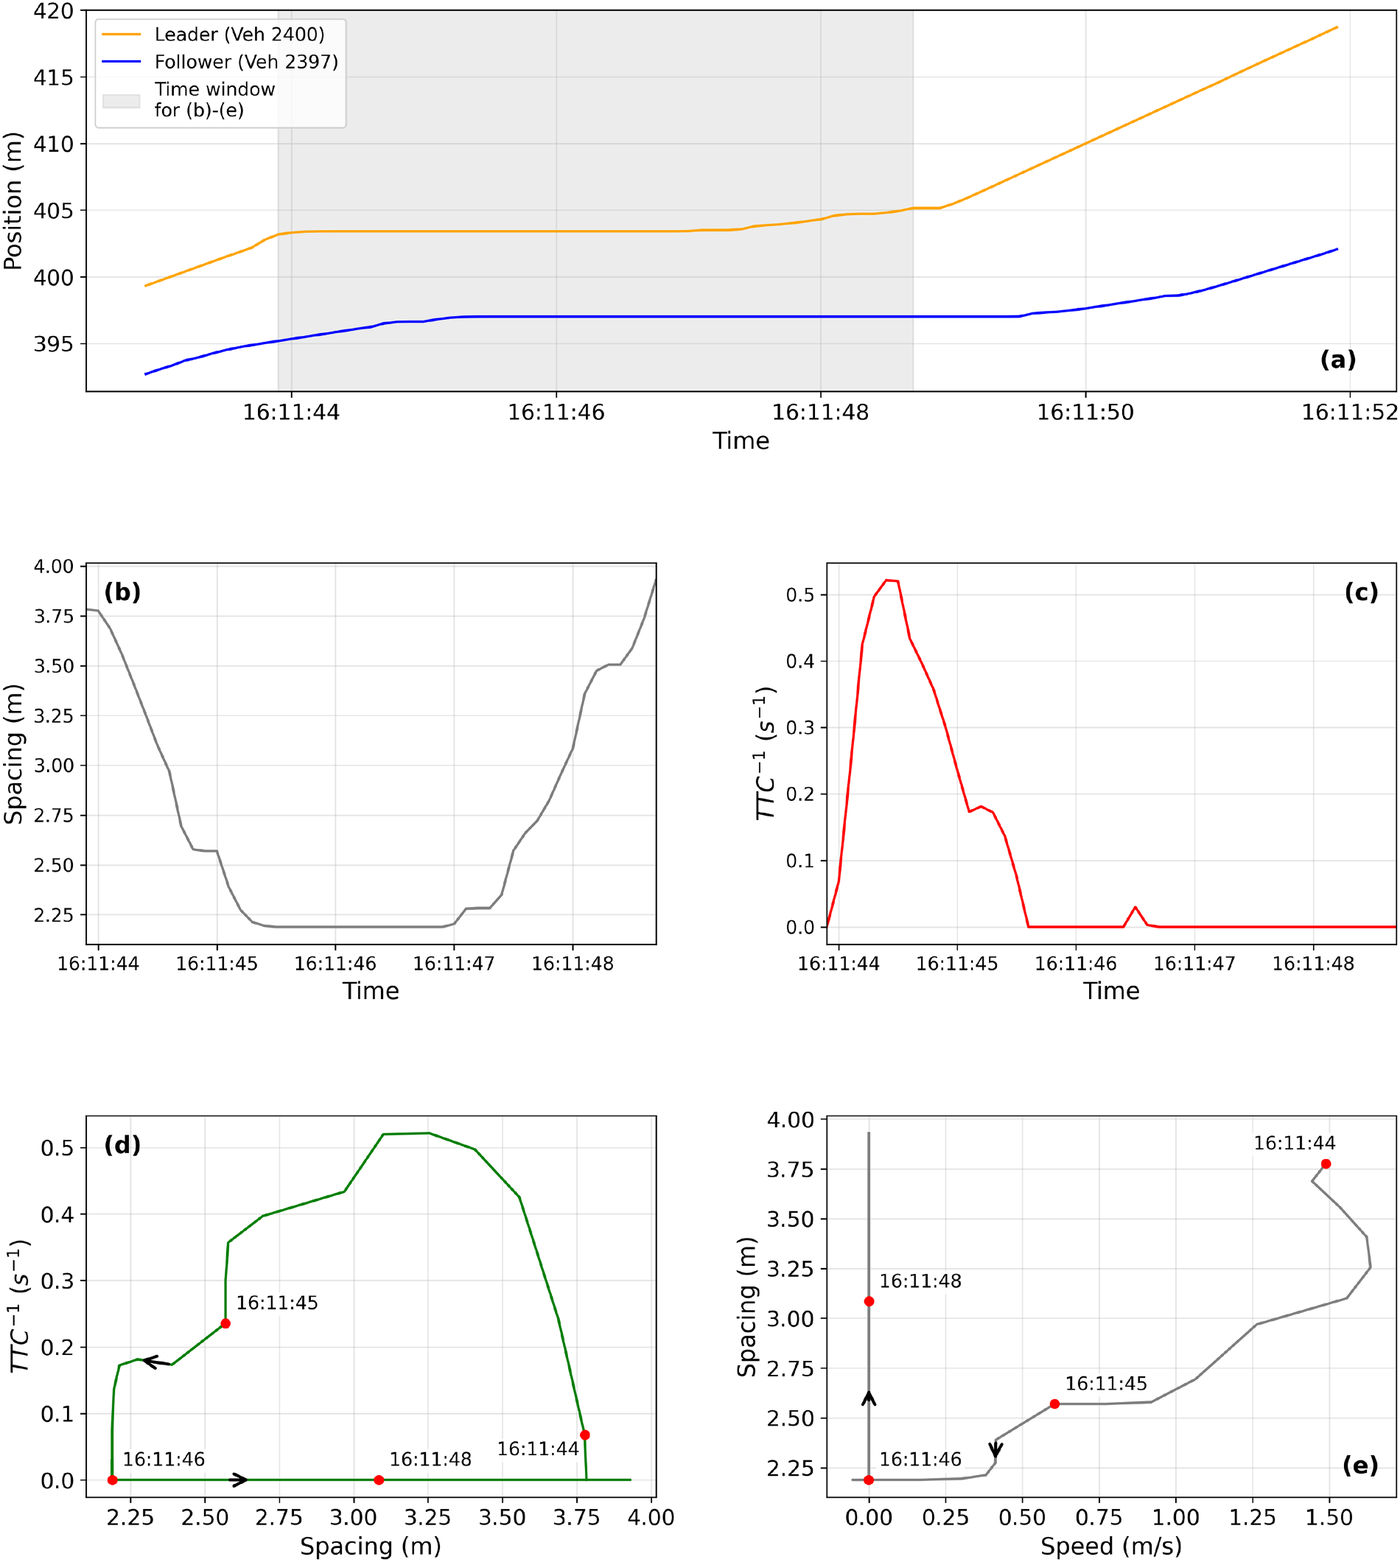
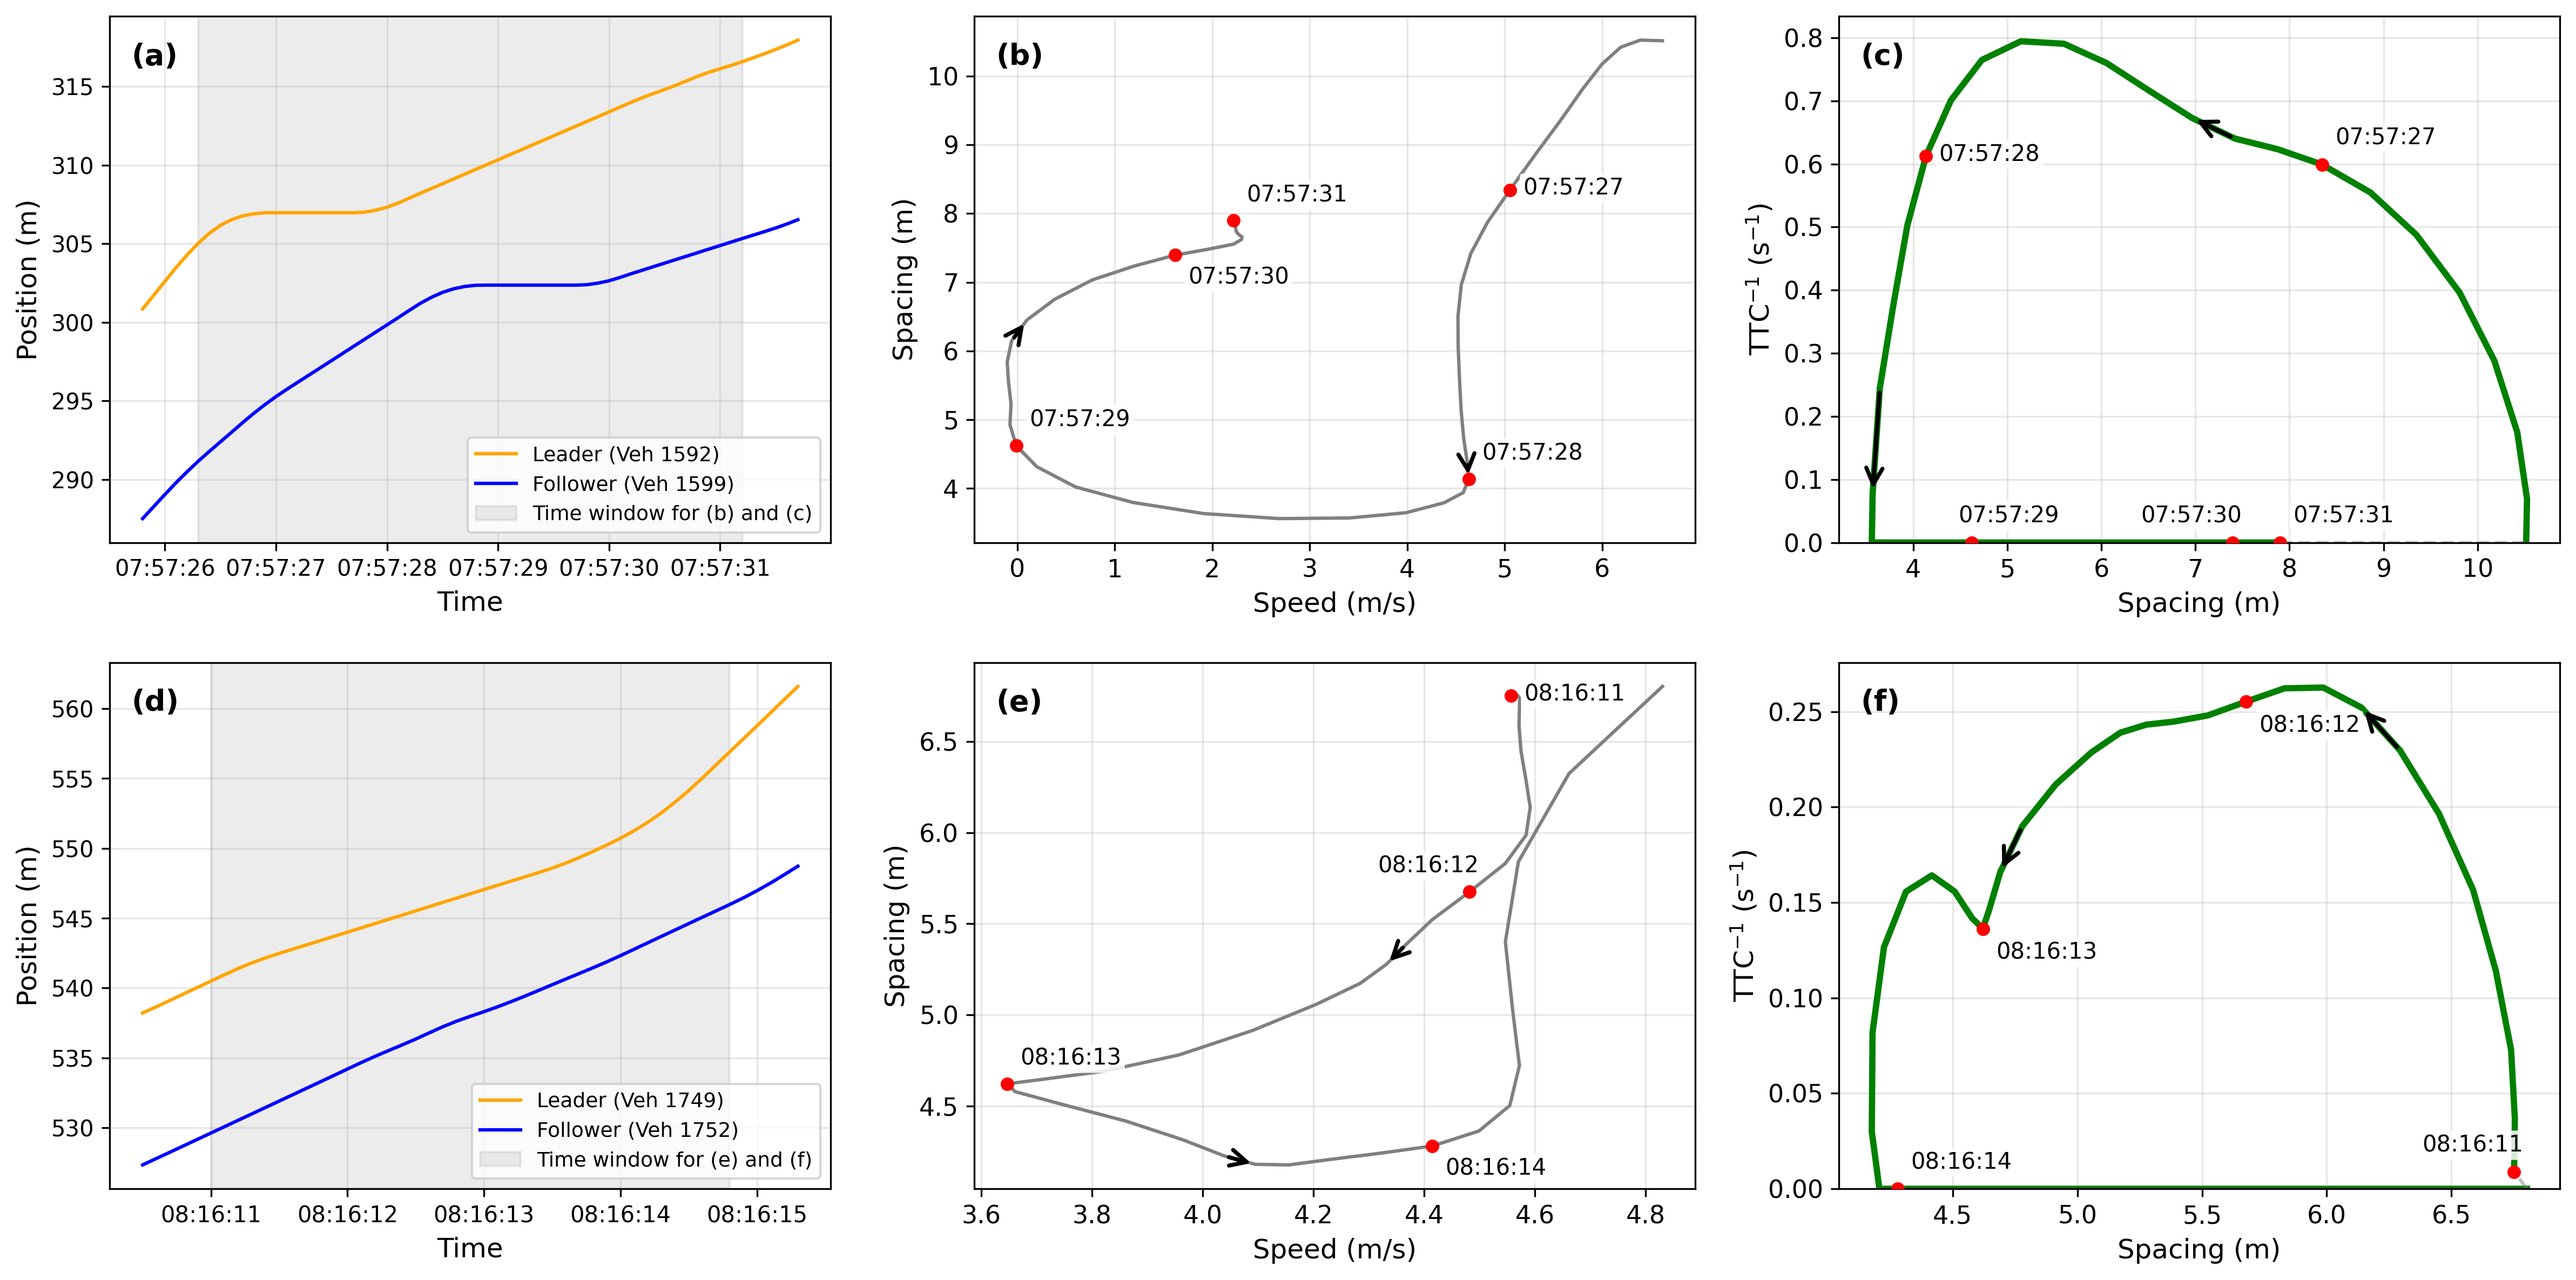
Safety hysteresis loop (d) on the spacing-TTC−1 diagram at the vehicle-pair level:
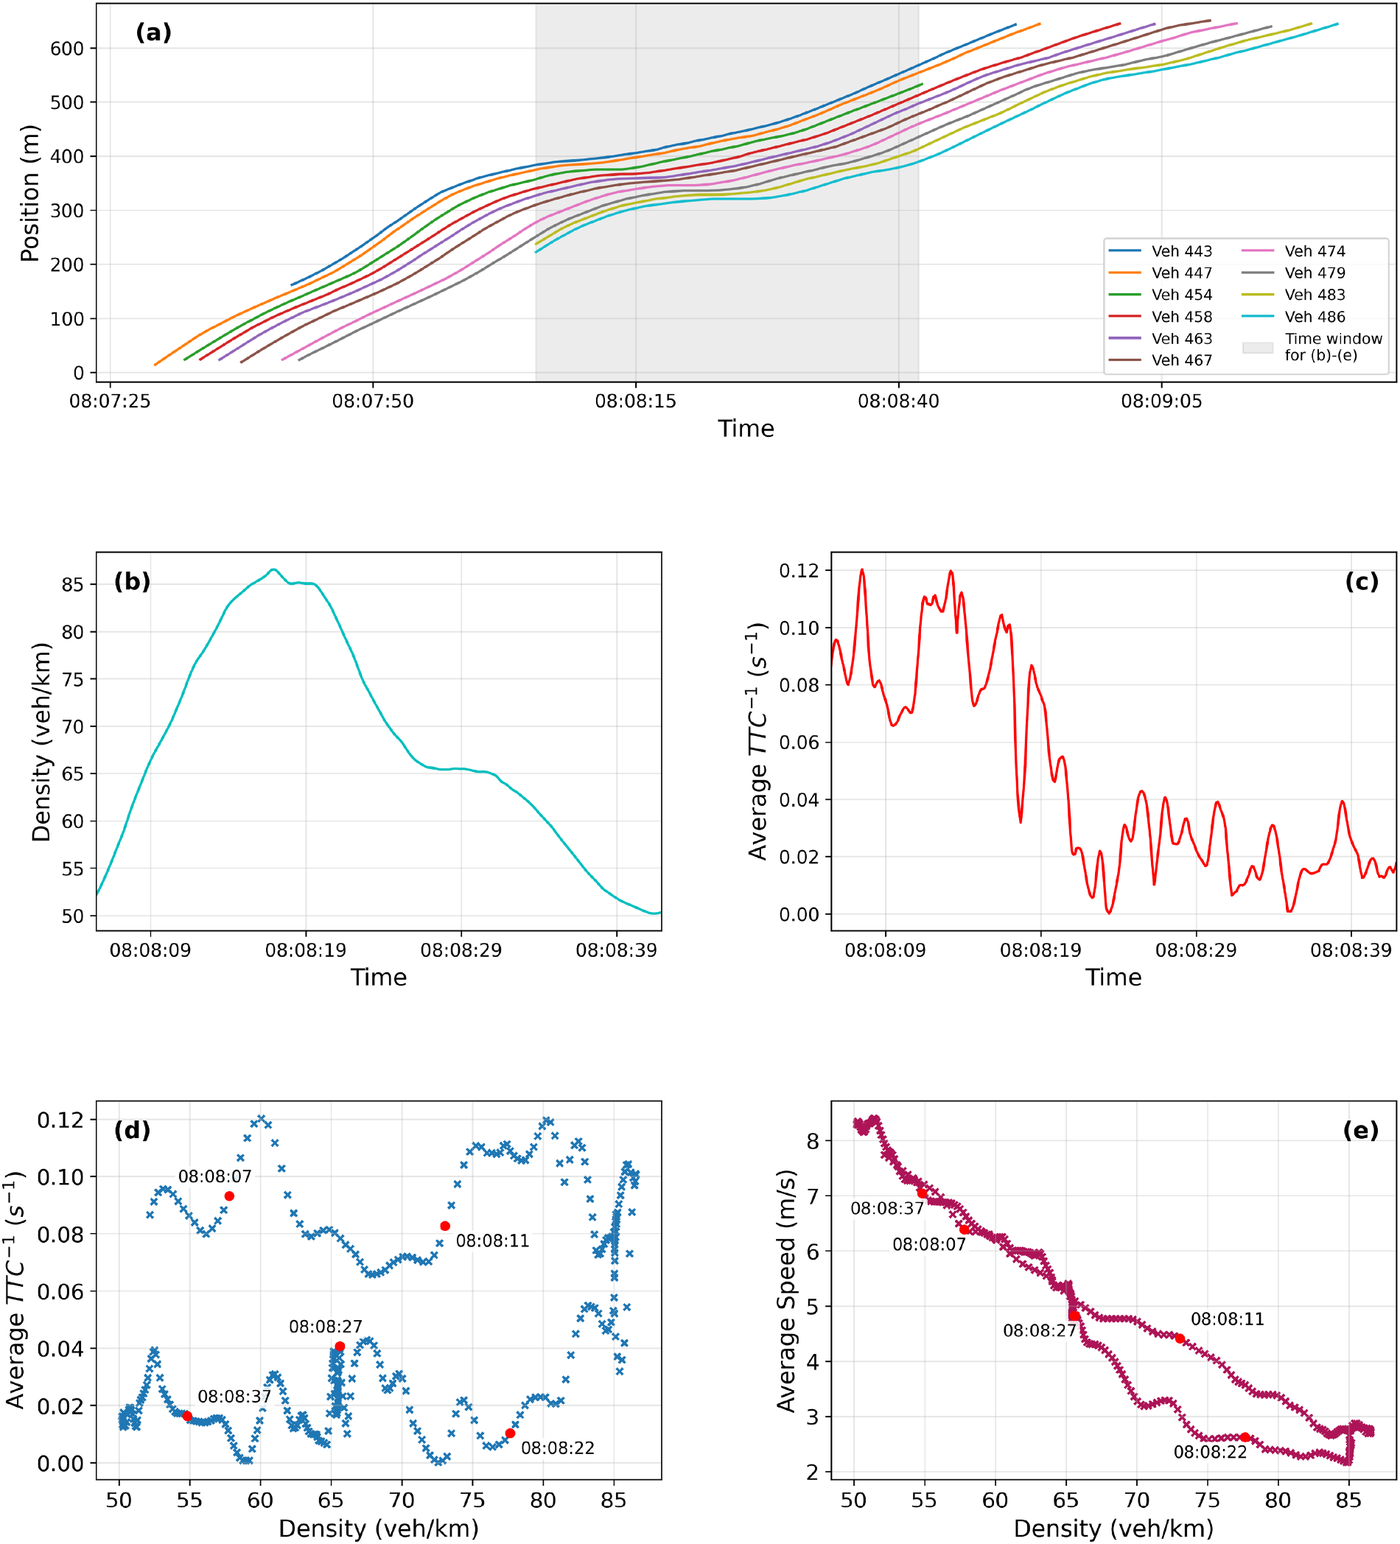
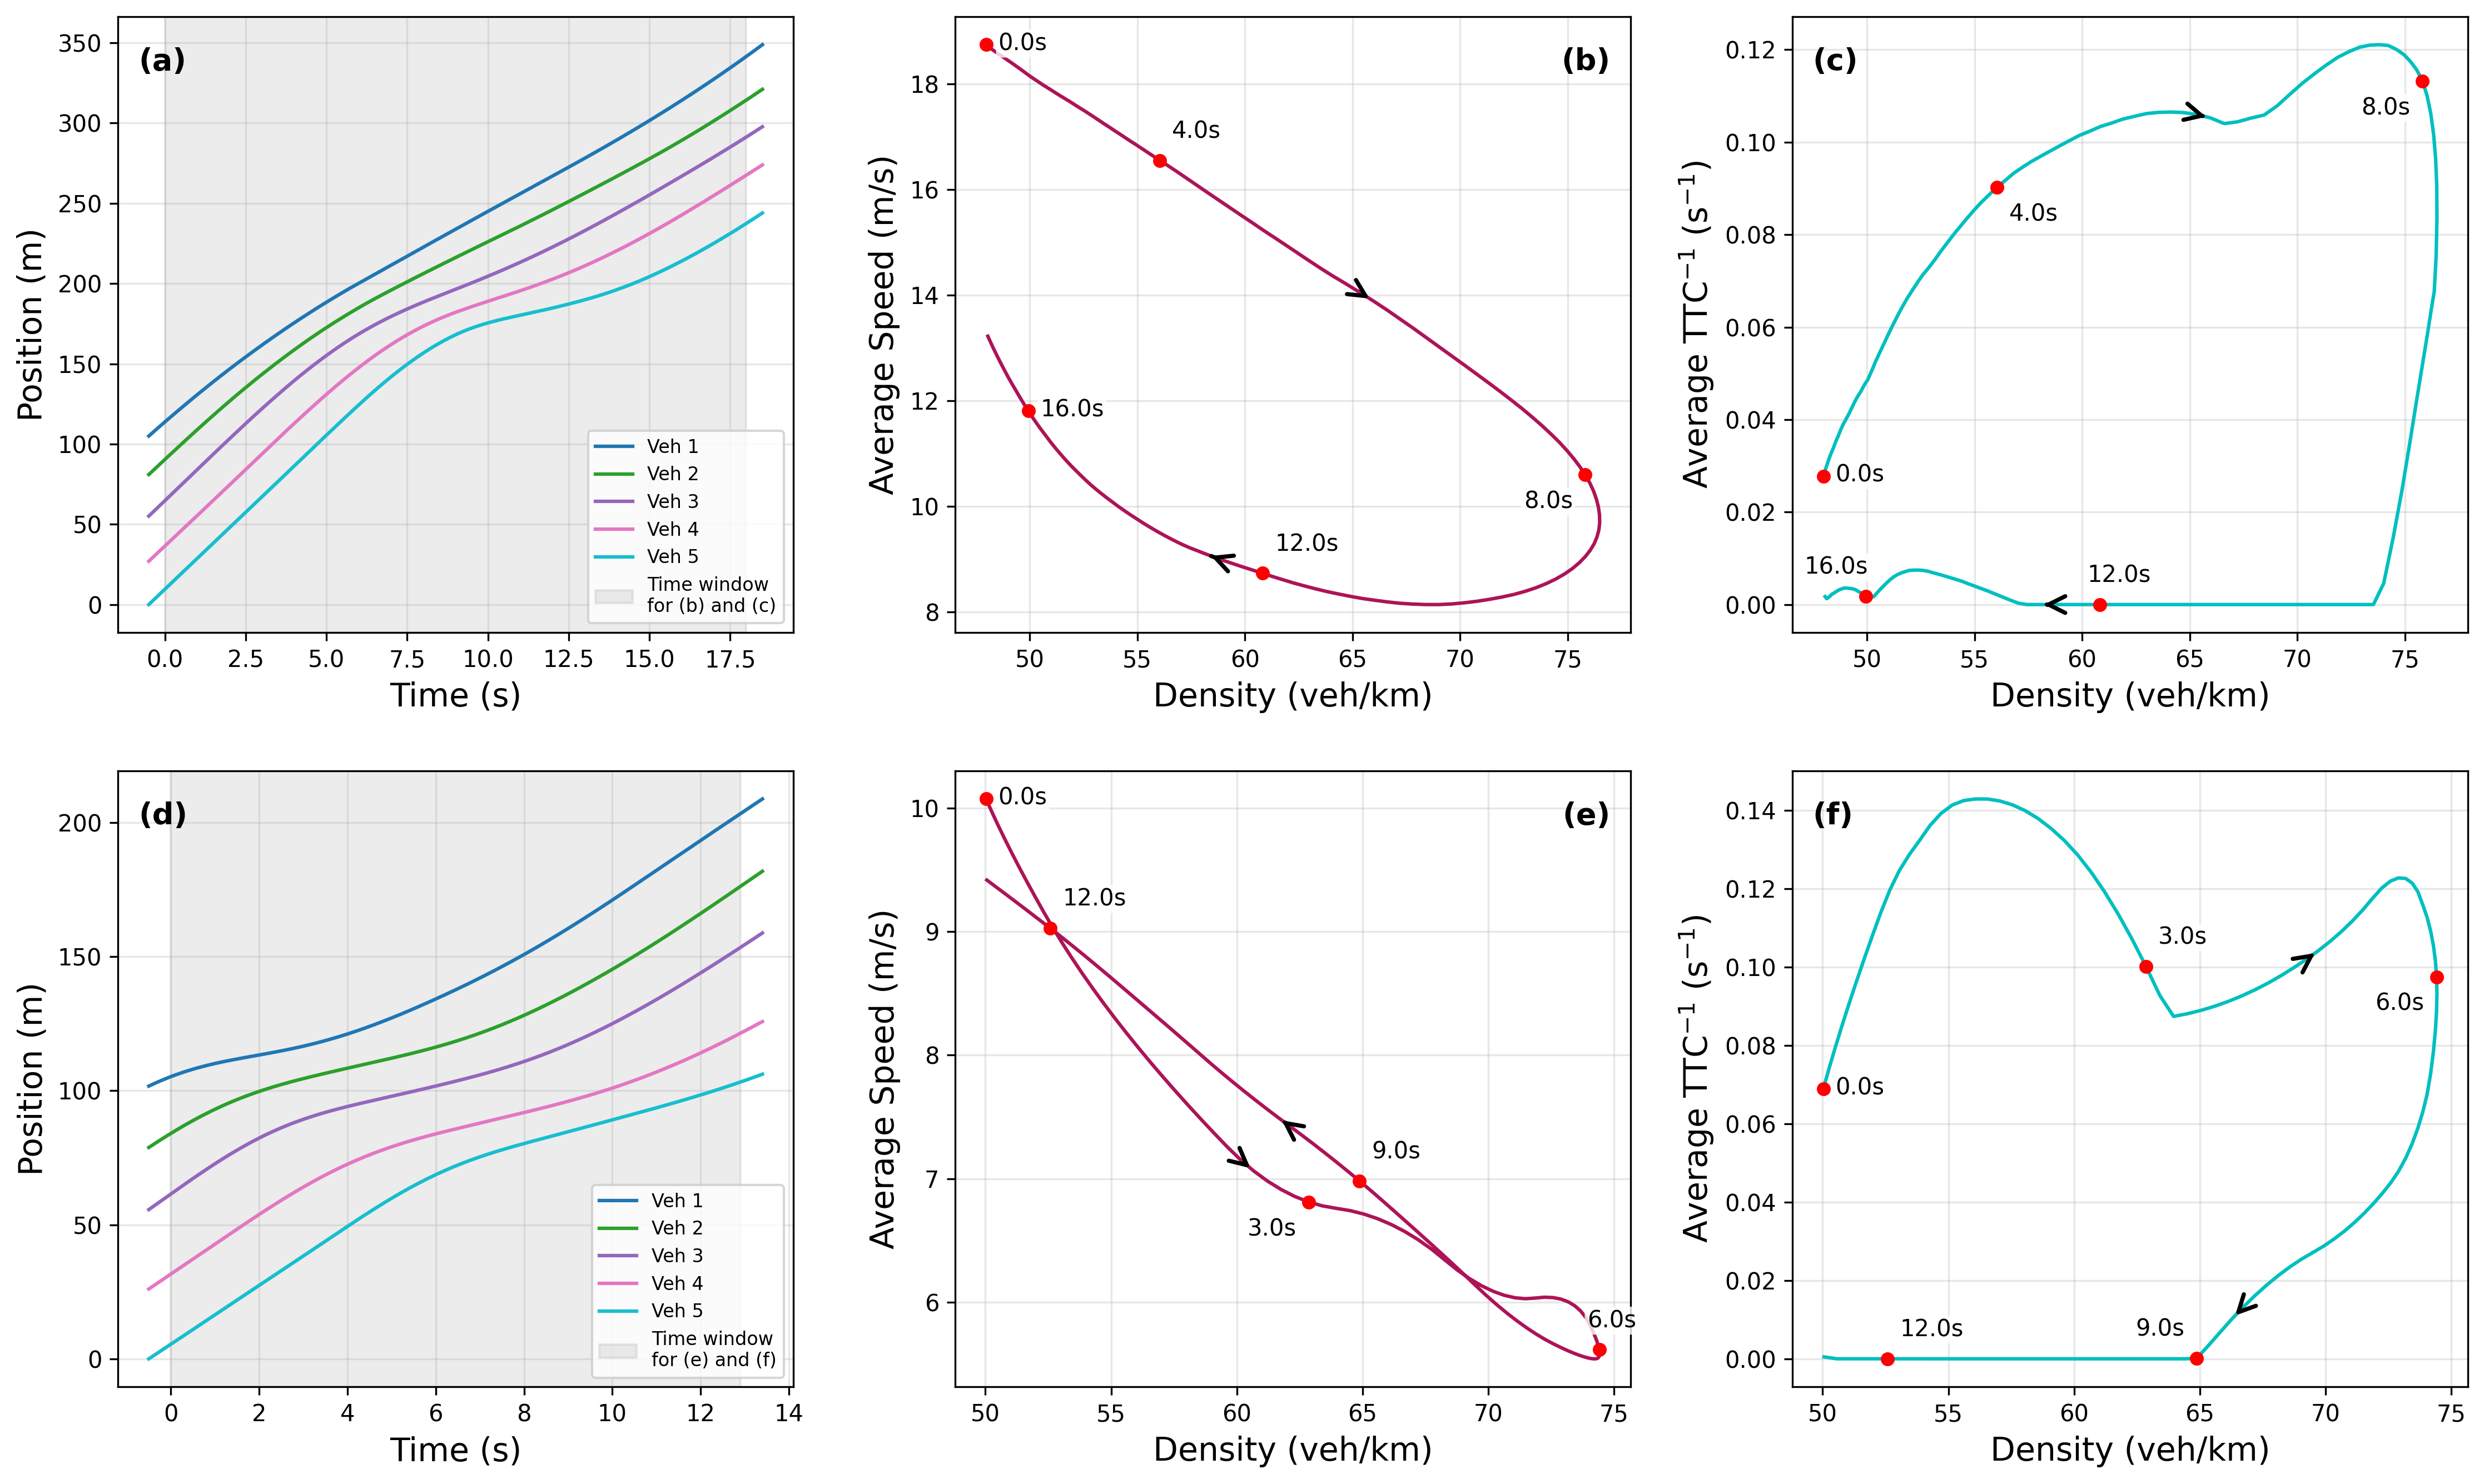
Safety hysteresis loop (d) on the density-\(\overline{TTC^{-1}}\) diagram at the platoon level:
Quantification of Safety Hysteresis
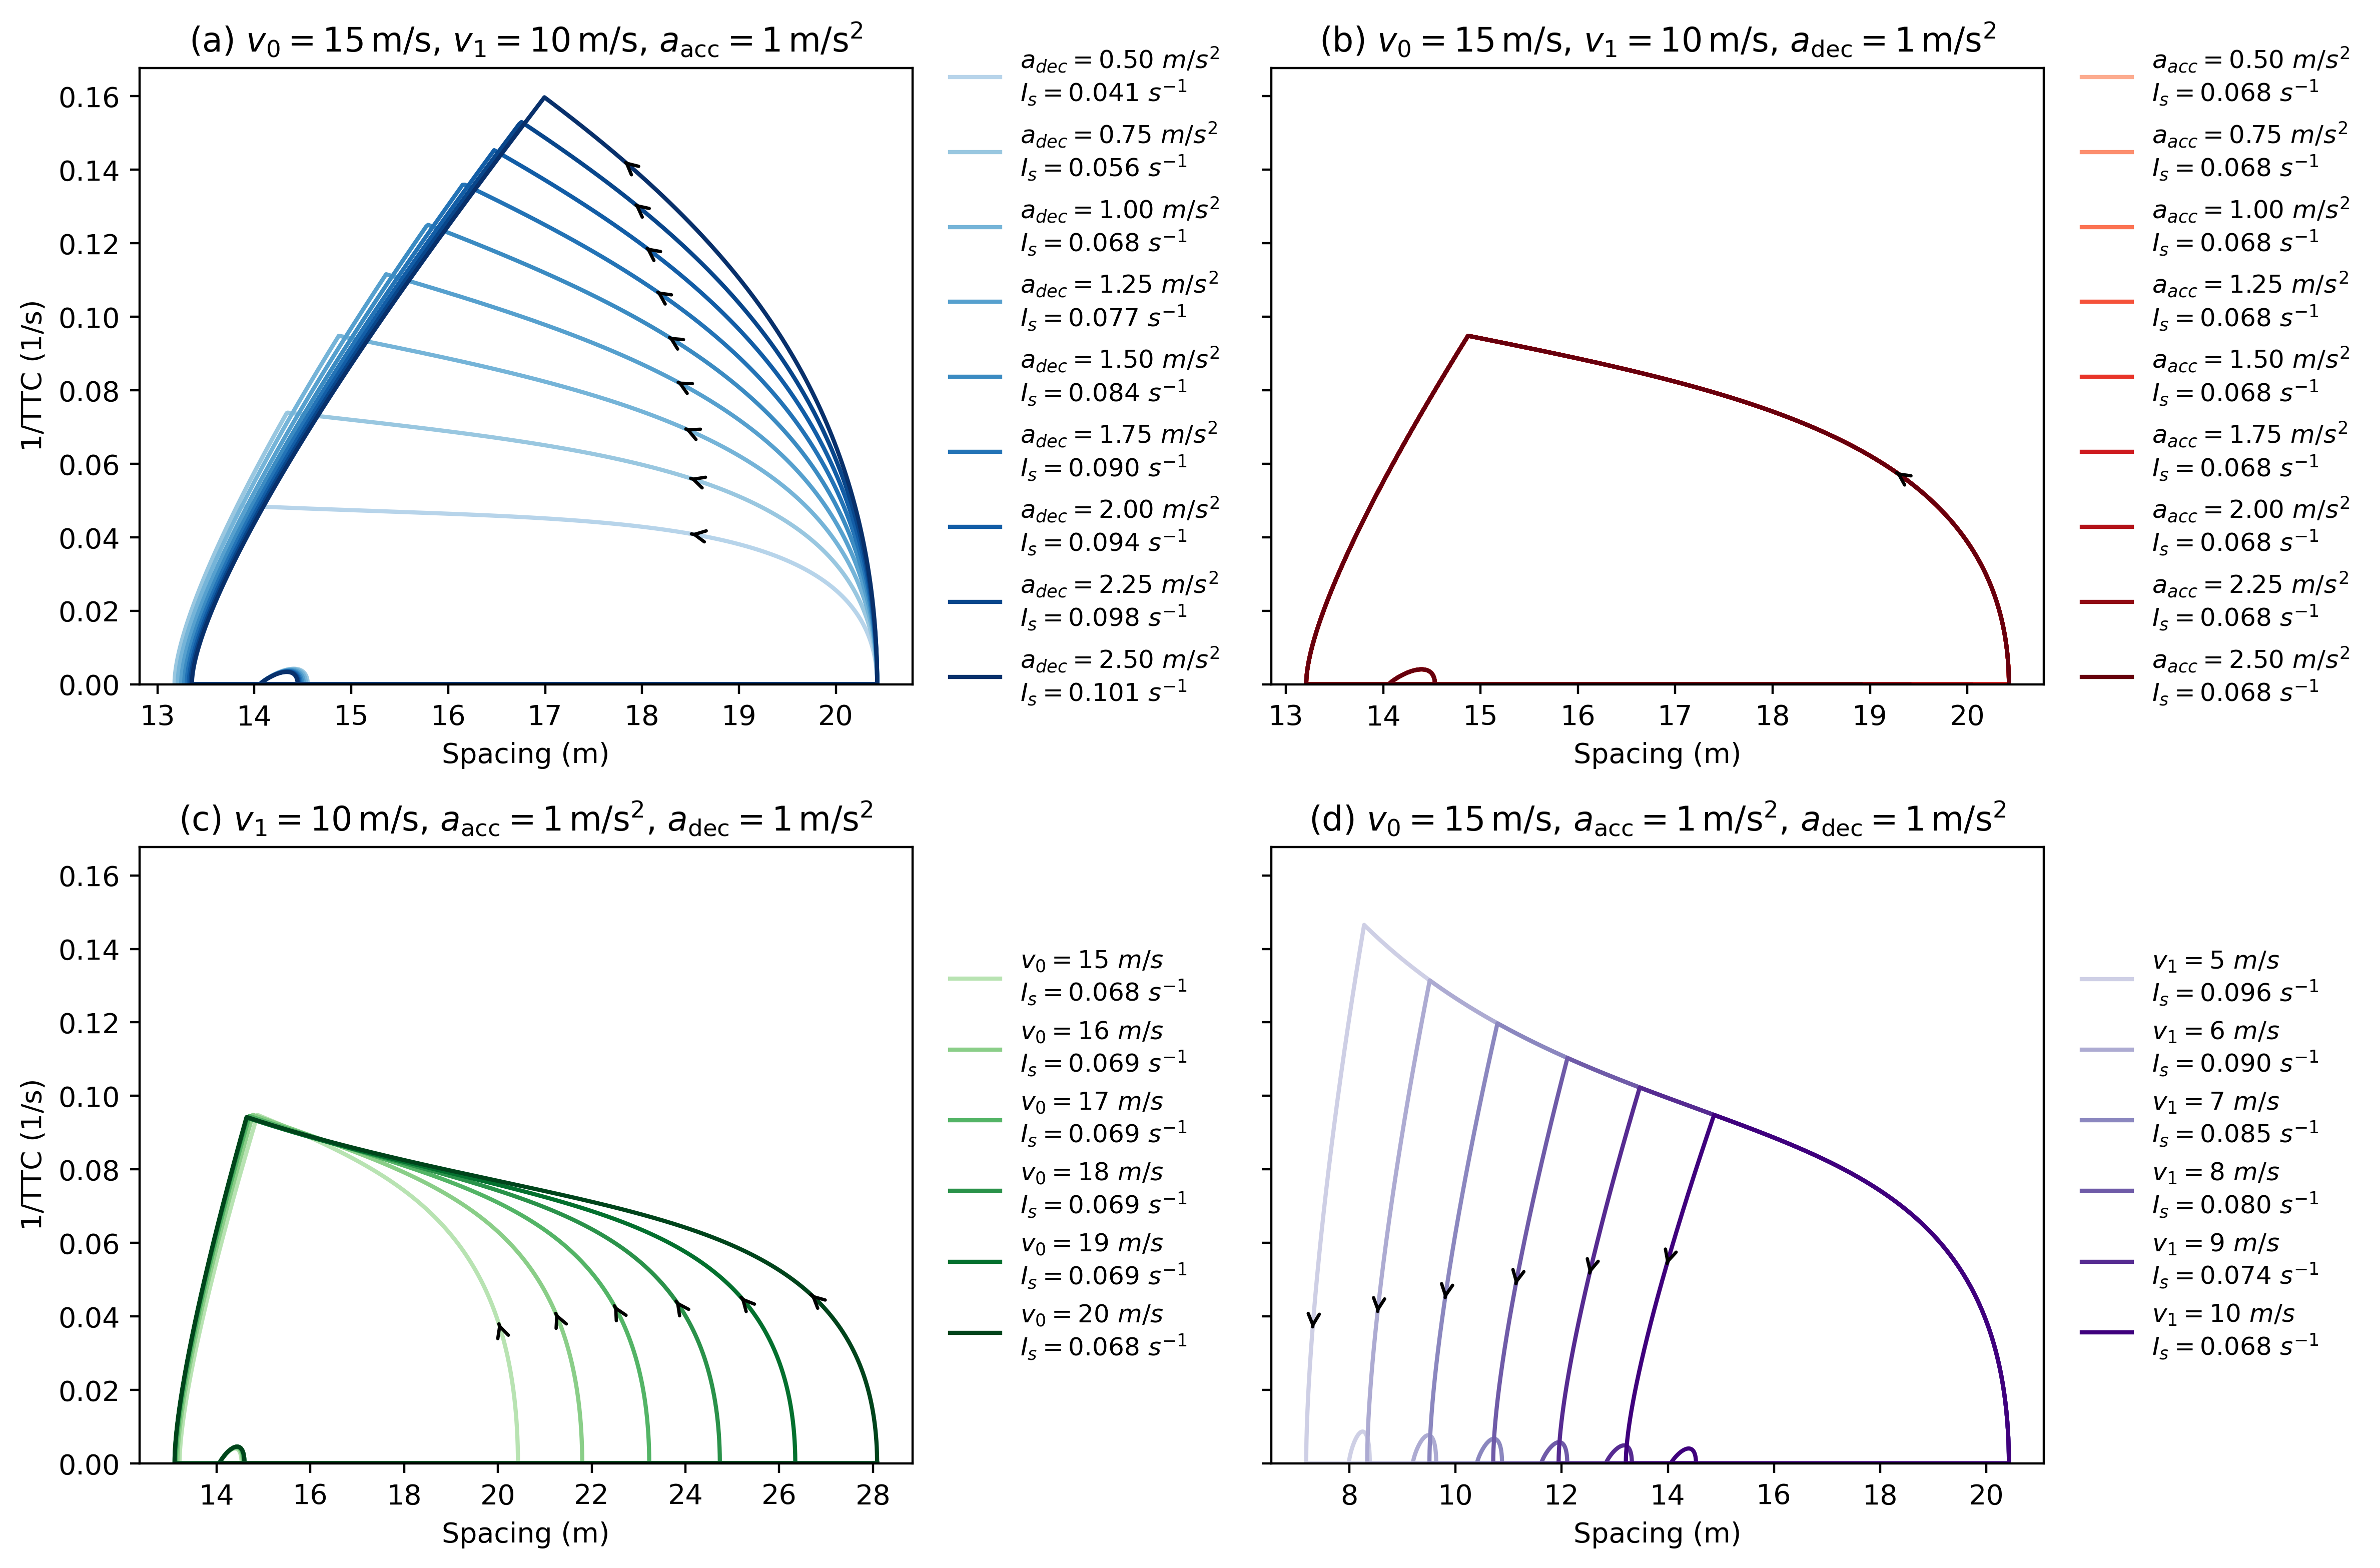
- Pair-level safety Hysteresis Intensity (HI):
where:
- |A| — area of the hysteresis loop A on the spacing-TTC−1 diagram for vehicle pairs
ΔsA — corresponding spacing span
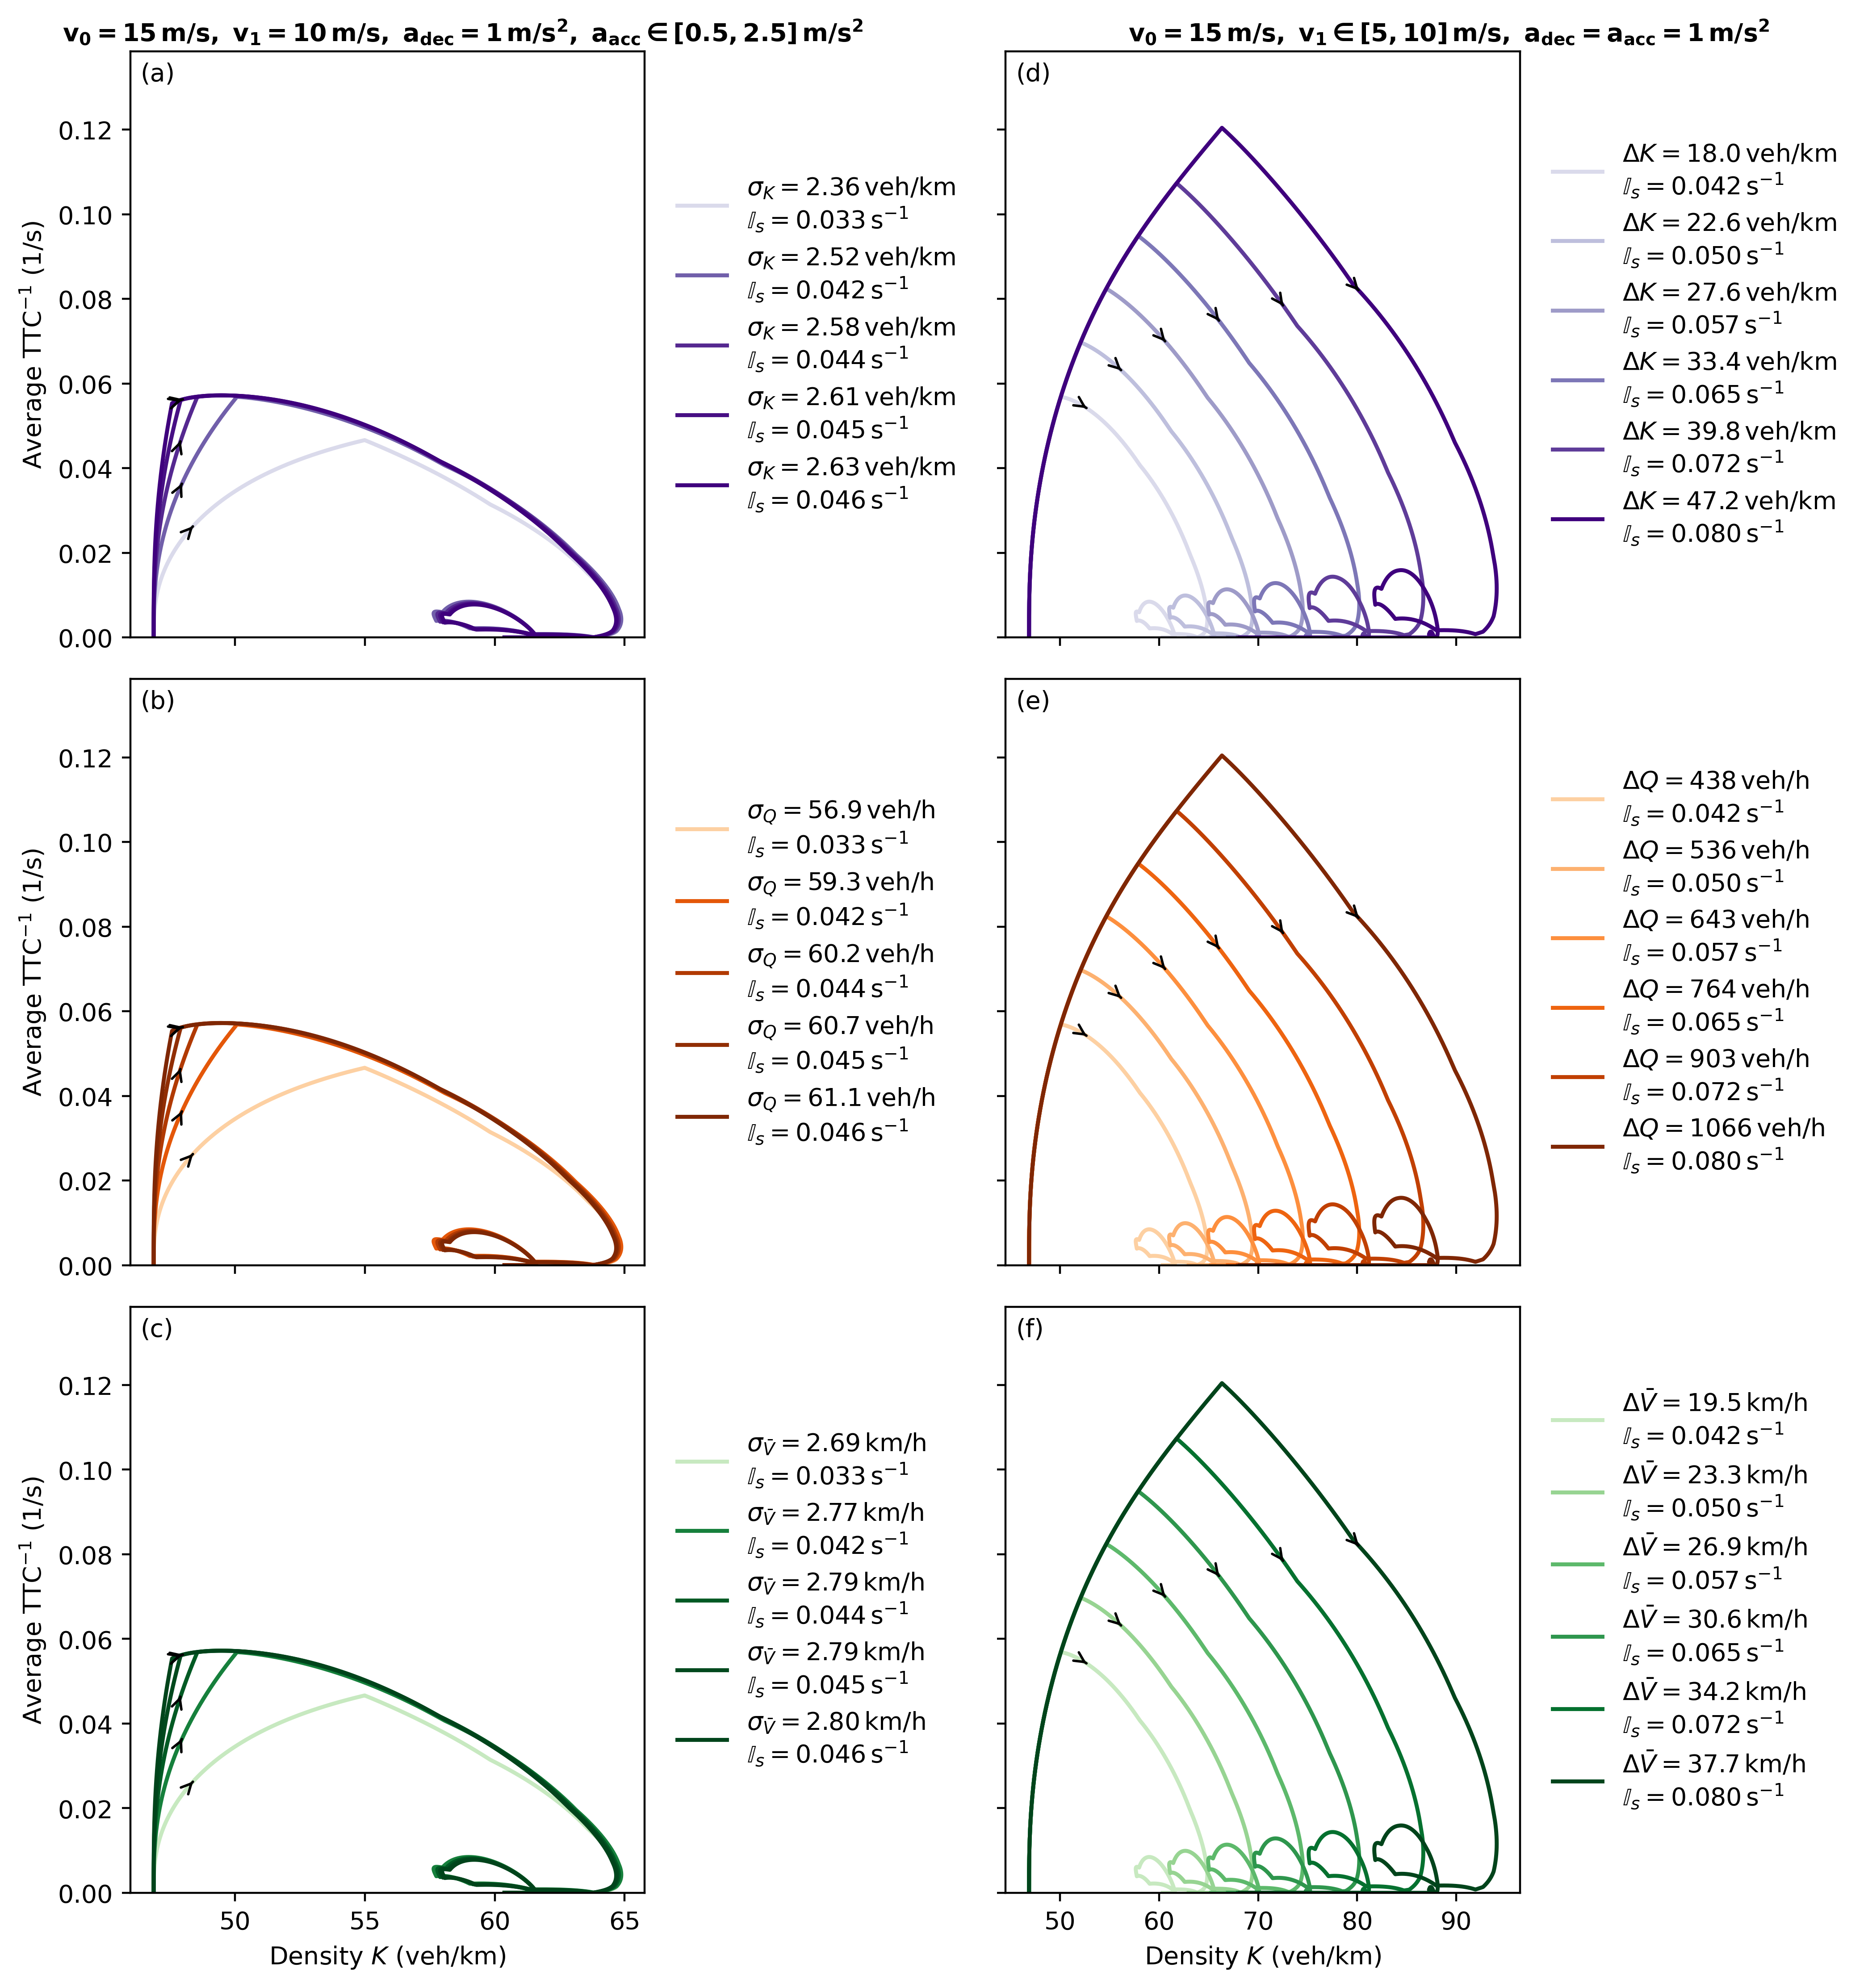
- Platoon-level safety HI:
where:
- |𝔸| — area of the hysteresis loop 𝔸
- Δk𝔸 — corresponding density span
Empirical Analysis
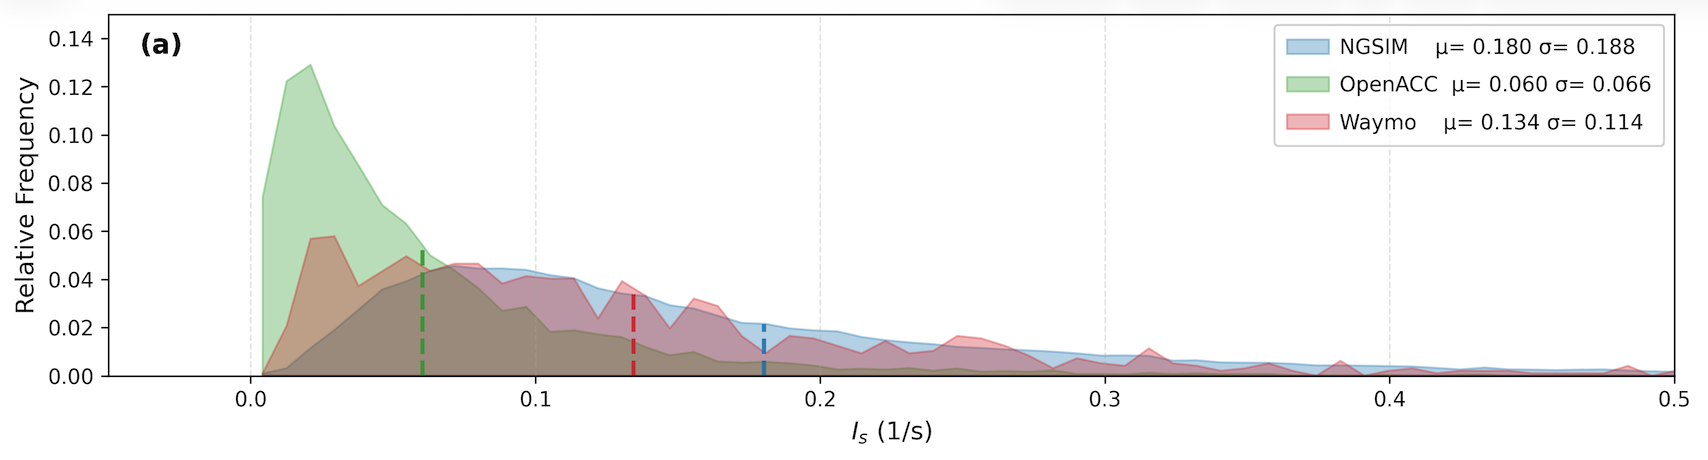
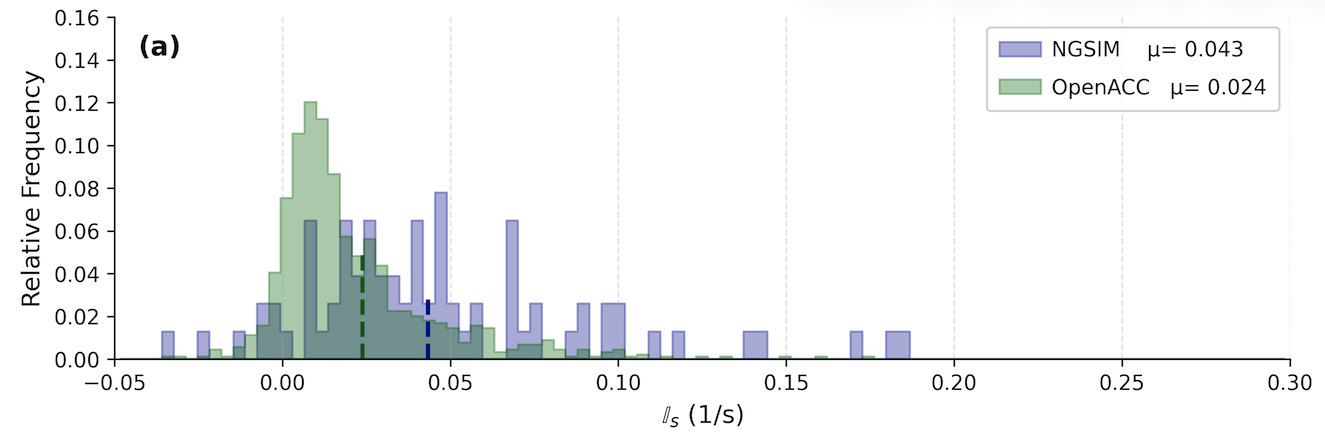
Distribution of safety HI at the vehicle-pair level across NGSIM, OpenACC, and Waymo datasets
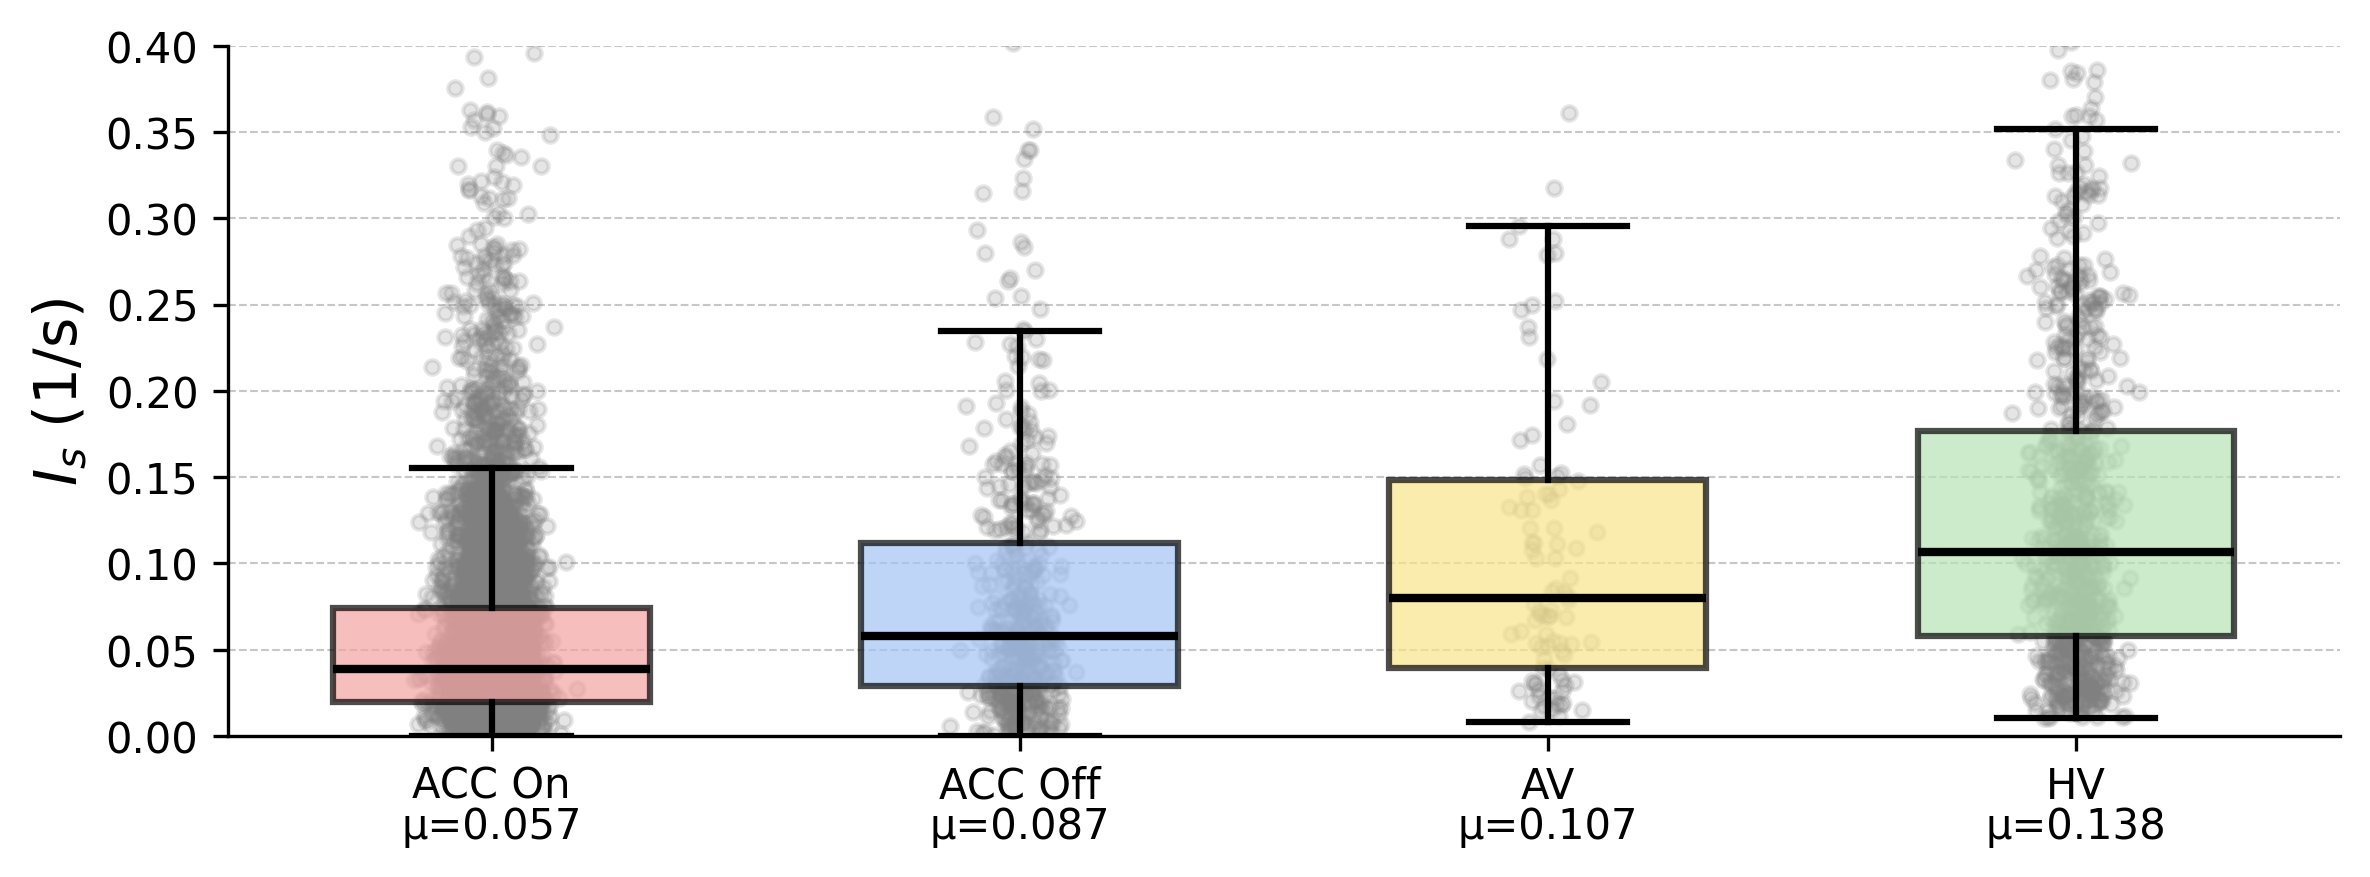
Distribution of safety HI at the vehicle-pair level across different driving modes
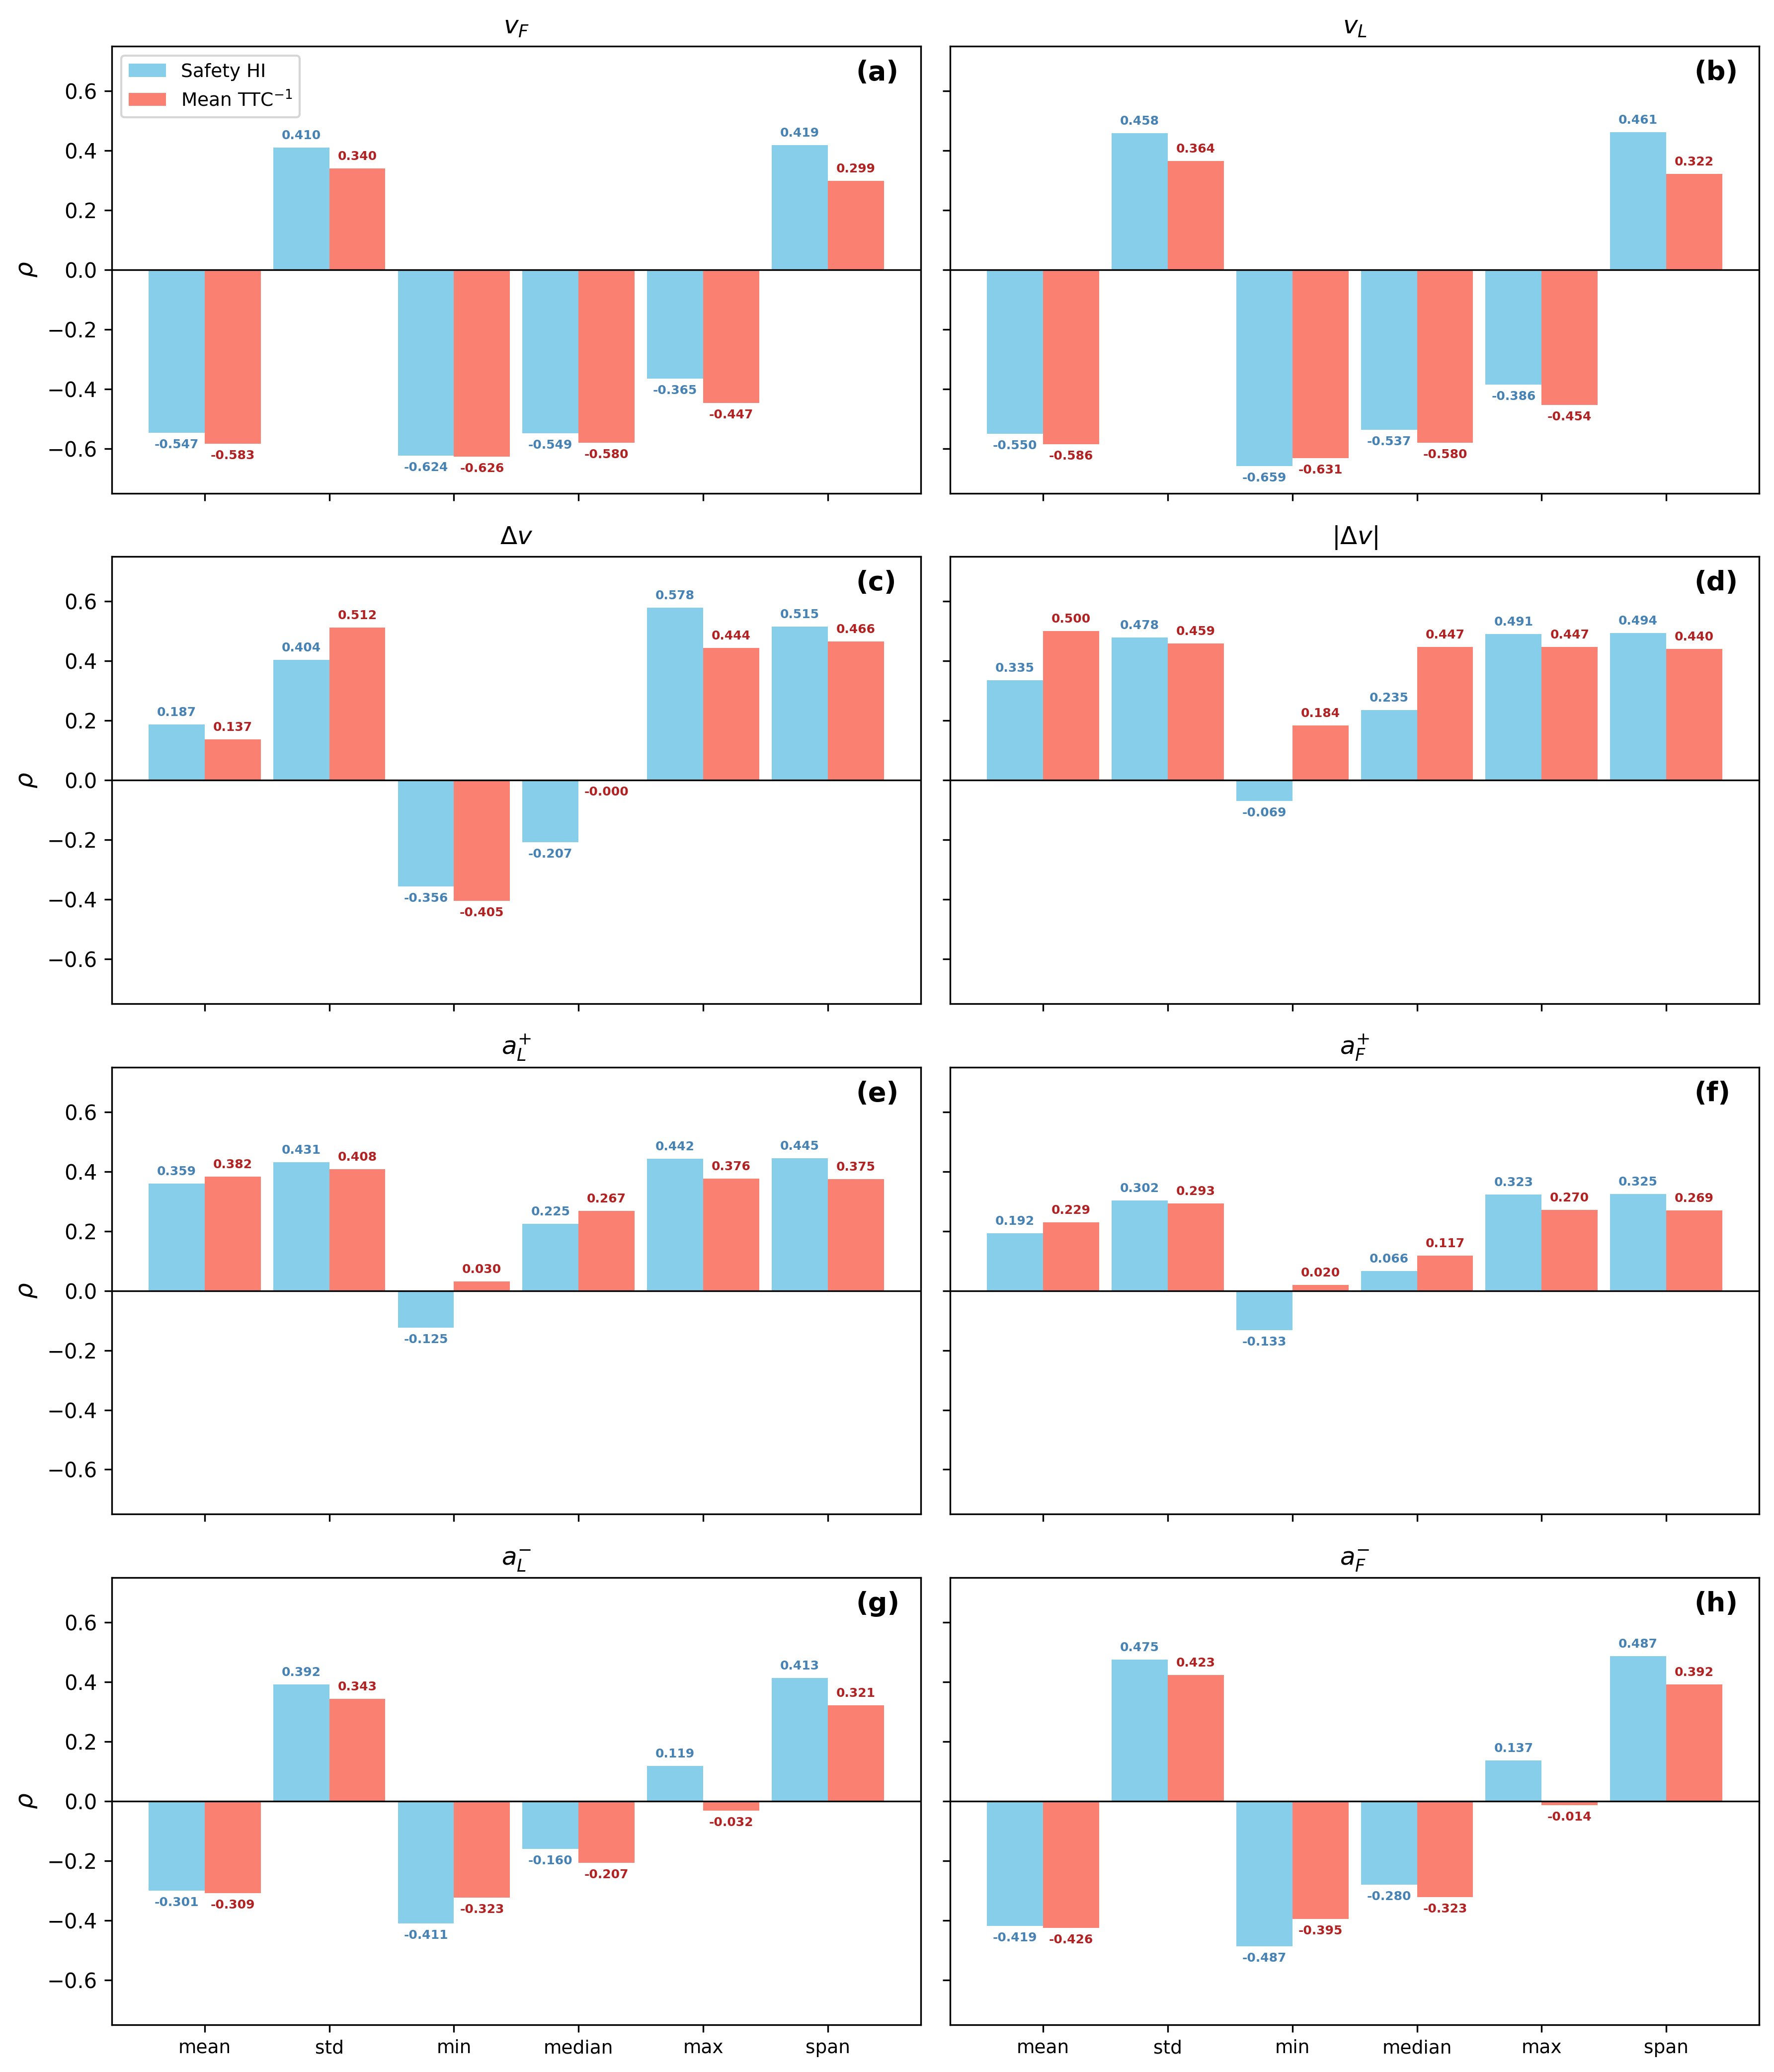
Correlation coefficients between selected vehicle-pair traffic variables and safety HI
Distribution of safety HI at the platoon level across NGSIM and OpenACC datasets
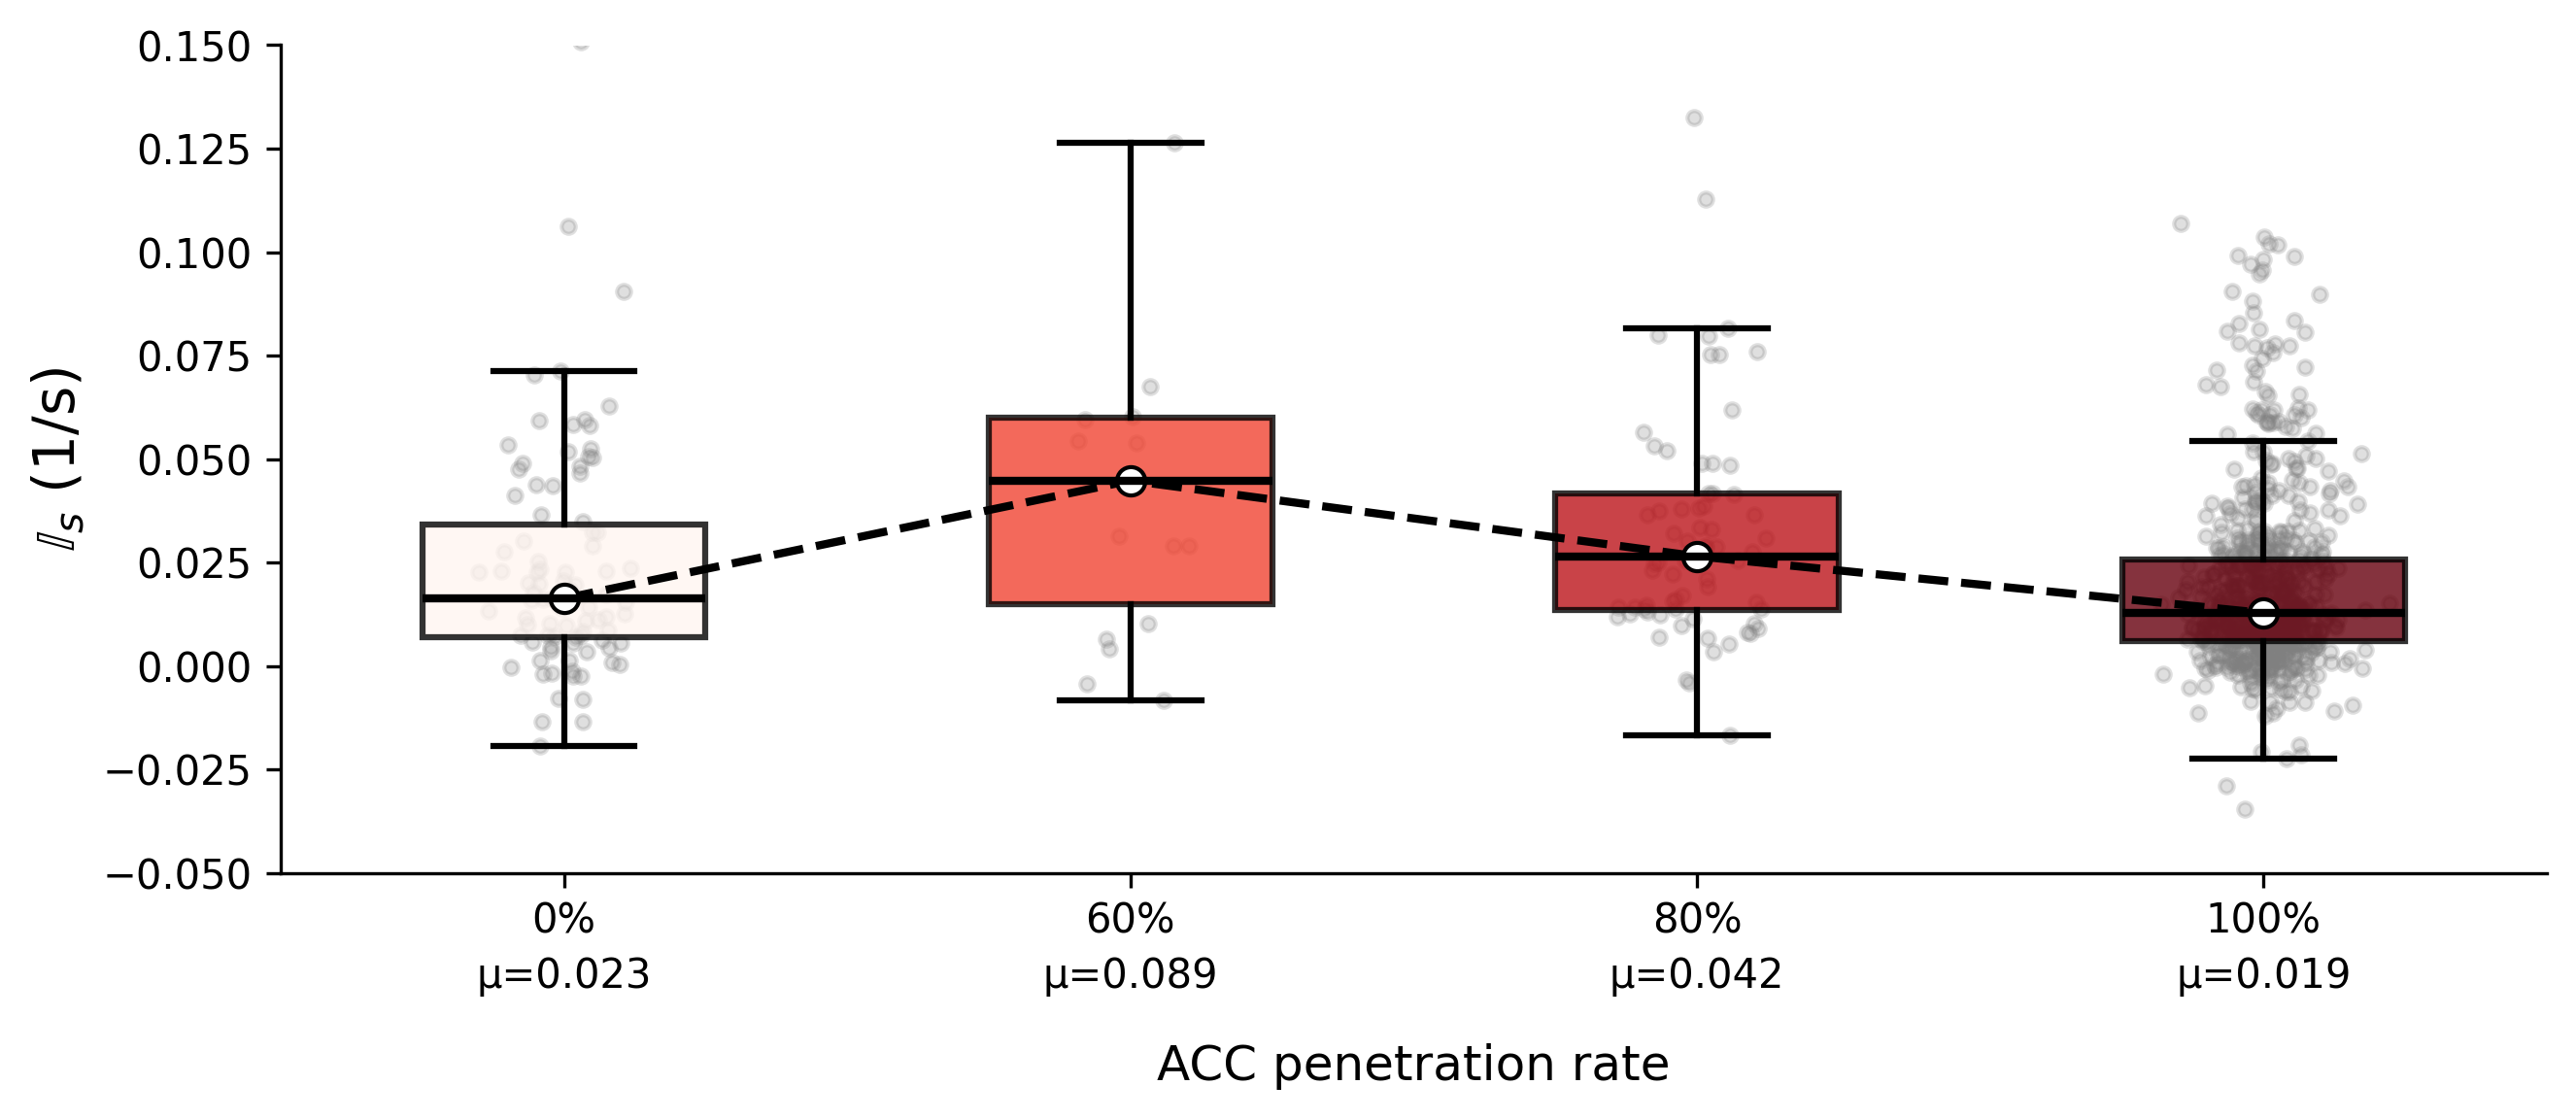
Distribution of safety HI at the platoon level across different ACC penetration rates
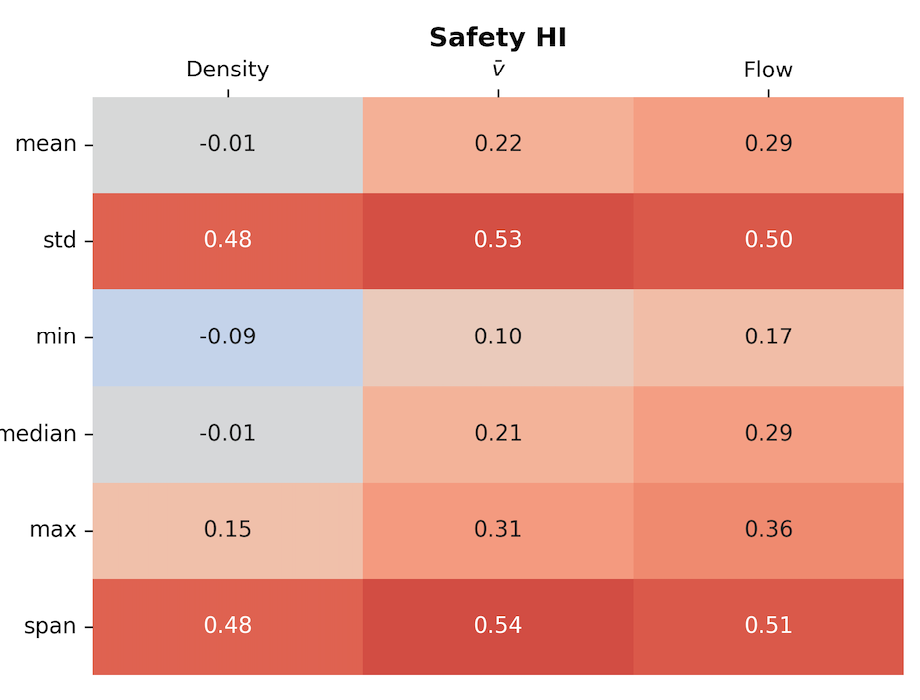
Correlation coefficients between selected platoon-level traffic variables and safety HI
Simulation Experiments
Vehicle-pair level. Stronger braking and lower post-deceleration speeds raise safety HI, while acceleration rate and initial speed have little independent effect.
Platoon level. Greater variability (standard deviation and range) in density, flow, and average speed consistently amplifies safety HI.
Relation to Traditional Traffic Hysteresis
Vehicle-pair level. Both timid (CW) and aggressive (CCW) traditional loops yield a counterclockwise safety loop: a physical necessity, since a loop can only begin when the follower is faster than the leader, and that same condition forces the counterclockwise direction.
Platoon level. Likewise, both clockwise and counterclockwise traditional loops predominantly map to positive (clockwise) safety HI, though aggressive driving raises the chance of the opposite sign.
Conclusion
This study provides the first comprehensive examination of safety hysteresis using large-scale trajectory data, showing it exists at both the vehicle-pair and platoon levels, and proposes Safety Hysteresis Intensity (HI), the loop area normalized by its span.
Naturalistic datasets (NGSIM, Waymo) exhibit higher HI than controlled ACC experiments; both ACC activation and autonomous driving significantly reduce safety HI.
Low-speed regimes, large leader–follower speed differences, and abrupt acceleration or deceleration are key contributors to pair-level HI, while larger fluctuations in flow, density, and speed govern platoon-level HI; ACC penetration mitigates these effects.
IDM simulations clarify these mechanisms, indicating that safety hysteresis can be reduced by smoothing deceleration profiles, damping traffic oscillations, and leveraging ACC/AV technologies.
Milestone
Jul 2024: Detected safety hysteresis at the vehicle-pair level in the simulation.
Sep 2024: Detected safety hysteresis at the platoon level in the simulation.
Dec 2024: Presented the findings of simulation experiments at the 28th International Conference of Hong Kong Society for Transportation Studies (HKSTS2024) (Poster).
Jan 2025: Preprocessed empirical datasets.
Mar 2025: Developed algorithms for safety hysteresis event detection.
May 2025: Analysed the distribution of safety HI under different conditions.
Jul 2025: Investigated the correlation between safety HI and key traffic characteristics.
Nov 2025: Explored control strategies for safety HI via simulation experiments.
Jun 2026: Published the article in Transportation Research Part C: Emerging Technologies.
DOI: 10.1016/j.trc.2026.105806
License: © 2026. This manuscript version is made available under the CC BY-NC-ND 4.0 license.
Recommended citation: Zhao, P., Wong, Y. D., & Zhu, F. (2026). Safety hysteresis in traffic flow: Evidence from vehicle trajectory data. Transportation Research Part C: Emerging Technologies, 190, 105806.
Download Paper